Data Visualization of Monte Carlo Approximation
Kevin Liu
5/20/2020
I wrote a short webpage about classical Monte Carlo Integration method. In Example 3, I used Monte Carlo Integration method to get approximated value of \(\pi\). Following plot is a visulization of how Monte Carlo method works.
Monte Carlo Approximation of \(\pi\)
1. Simulate n random variables from uniform(-1,1) as \(X\).
2. Simulate n random variables from uniform(-1,1) as \(Y\).
3. Plot scatter plot using \(X\) and \(Y\) with a unit circle.
4. Calculate the proportion of the number of dots falling inside unit circle.
5. \(4\times\text{this proportion} \approx \pi\)
import numpy as np
import pandas as pd
import matplotlib.pyplot as plt
np.random.seed(520)

x = np.random.uniform(low = -1, high = 1, size = 1000)
y = np.random.uniform(low = -1, high = 1, size = 1000)
df_plot = pd.DataFrame({"x":x,"y":y})
index = (((df_plot.x)**2 + (df_plot.y)**2) < 1)
df1 = df_plot.loc[index,:]
df2 = df_plot.loc[~index,:]

circle = plt.Circle((0, 0), 1, color='b', fill=False)

fig,ax = plt.subplots()
ax.scatter(df1["x"],df1["y"],color = '#1f77b4',label = "Accept")
ax.scatter(df2["x"],df2["y"],color = '#ff7f0e',label = "Reject")
ax.add_artist(circle)
ax.legend()
plt.title("Monte Carlo Approximation of Pi")
plt.show()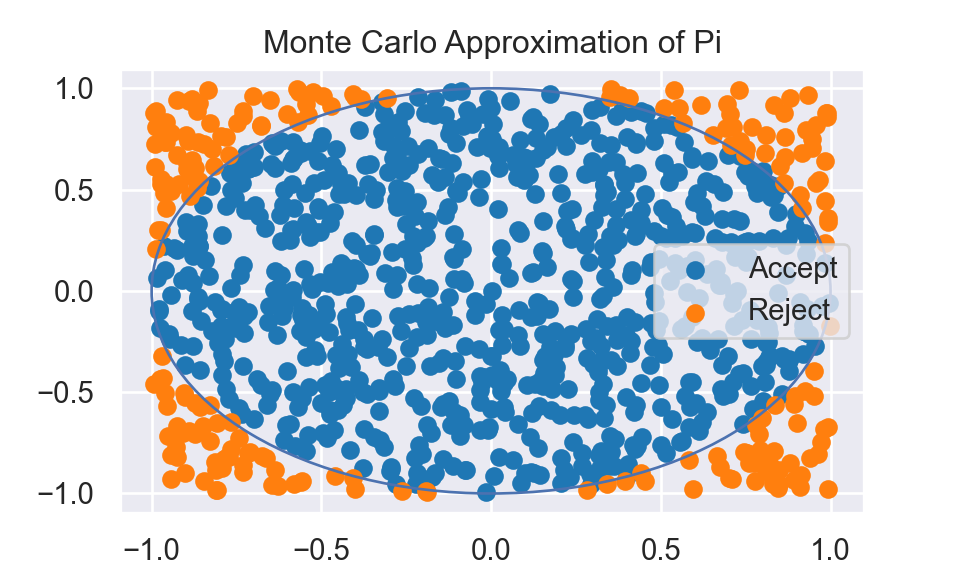
plt.close()