Image Process by python
Kevin Liu
6/04/2020
I record my study about image process in this webpage. It is a fun execrise using Image and matplotlib.
1 Read jpg file and resize
First, we need to learn how to read jpg file into python. Then use Image library, we can easily resize image.
from PIL import Image
import matplotlib.pyplot as plt
import numpy as np

##import image
Im1 = Image.open("./files/dog.jpg")

##resize
Im1 = Im1.resize((200,200))
plt.figure()
plt.imshow(Im1)
temp = plt.axis('off')
plt.show()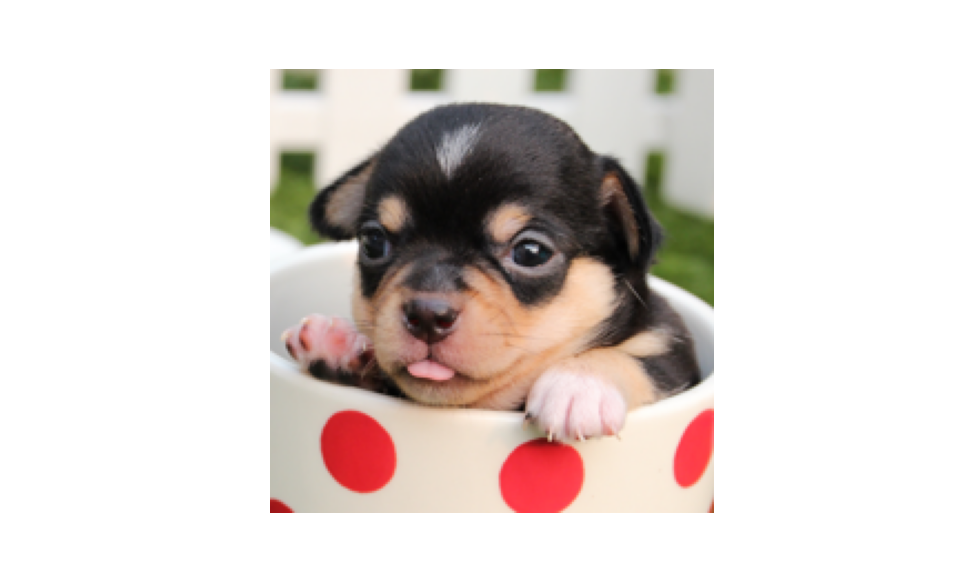
plt.close()2 Add Black Frame
For easy task like add black frame, we don’t really need software like Photoshop. Python can do the job for us.
def black_frame(filename="./files/dog.jpg",framesize=0.01):
  Im1 = Image.open(filename)
  width,height = Im1.size
  prop = 1-framesize*2
  rewidth = int(width*prop)
  reheight = int(height*prop)
  Im2 = Image.new('RGBA',(width,height),'black')
  Imtemp = Im1.resize((rewidth,reheight))
  Im2.paste(Imtemp,(int(width*framesize),int(height*framesize)))
  return Im2

plt.figure()
plt.imshow(black_frame())
temp = plt.axis('off')
plt.show()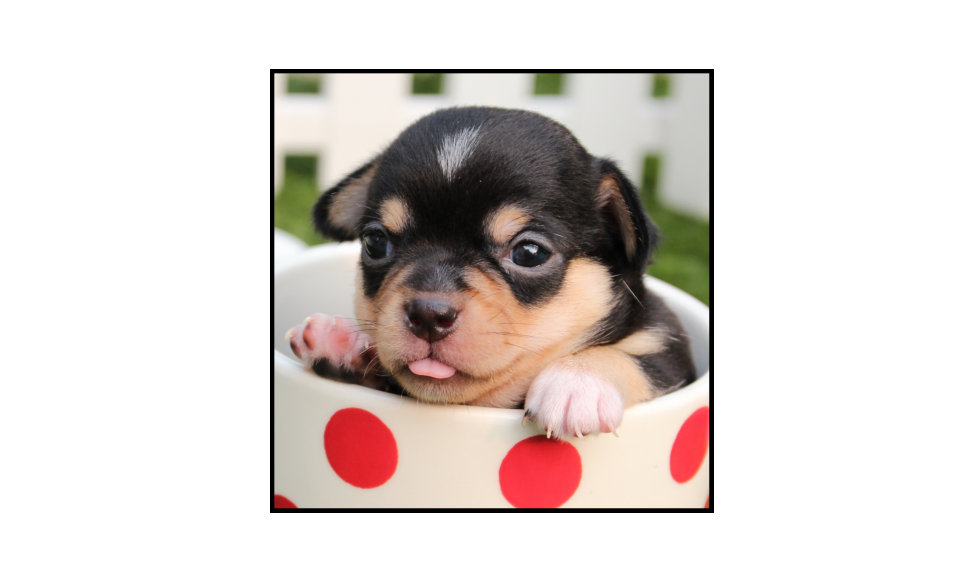
plt.close()3 Create multiple copies of the same photo
This maybe useful when we need to use online printing services.
##copy raw image

def copy_jpg(filename="./files/dog.jpg",ncol=3,nrow=2,blackframe=True,framesize=0.01):
  if blackframe == True:
    Im1 = black_frame(filename=filename,framesize=framesize)
  if blackframe != True:
    Im1 = Image.open(filename)
  width,height = Im1.size
  ncol = 3
  nrow = 2
  Im2 = Image.new('RGBA',(width*ncol,height*nrow))
  for left in range(0,width*ncol,width):
    for top in range(0,height*nrow,height):
      Im2.paste(Im1,(left,top))
  return Im2

plt.figure()
plt.imshow(copy_jpg())
temp = plt.axis('off')
plt.show()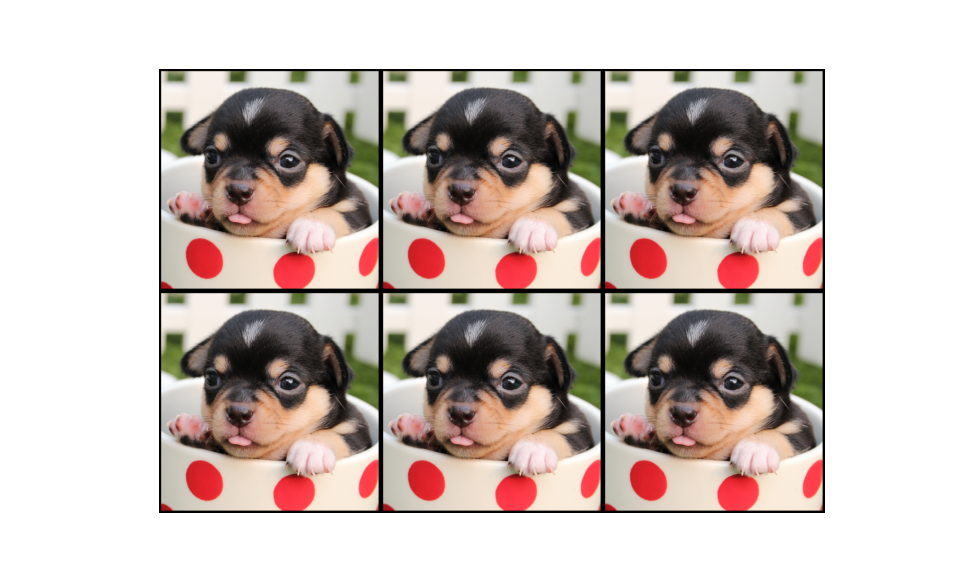
plt.close()4 Image Compression by Singular Value Decomposition (SVD)
This is an interesting application of SVD method we learned from linear algebra course.
def SVD_jpg(filename="./files/dog.jpg",ncomp=15):
  Im1 = Image.open(filename)
  X = np.array(Im1)
  shape1,shape2,shape3 = X.shape
  n = int(ncomp)
  output = np.zeros(shape1*shape2*shape3,dtype=np.uint8)
  output = output.reshape(shape1,shape2,shape3)
  for i in range(X.shape[2]):
    temp = X[:,:,i]
    U,s,V = np.linalg.svd(temp)
    diagncomp = np.diag(np.zeros(U.shape[0]))
    diagncomp[range(n),range(n)] = 1
    temp = (U@np.diag(s)@diagncomp)@V
    output[:,:,i] = temp
  return output

ncomplist = np.linspace(5,35,4)
num=0
fig,ax = plt.subplots(nrows=2,ncols=2)
for i in range(2):
  for j in range(2):
    ax[i][j].imshow(SVD_jpg(ncomp=int(ncomplist[num])))
    ax[i][j].axis('off')
    ax[i][j].set_title("ncomp={}".format(int(ncomplist[num])))
    num = num + 1
plt.subplots_adjust(hspace=0.5,wspace =0.5)
plt.show()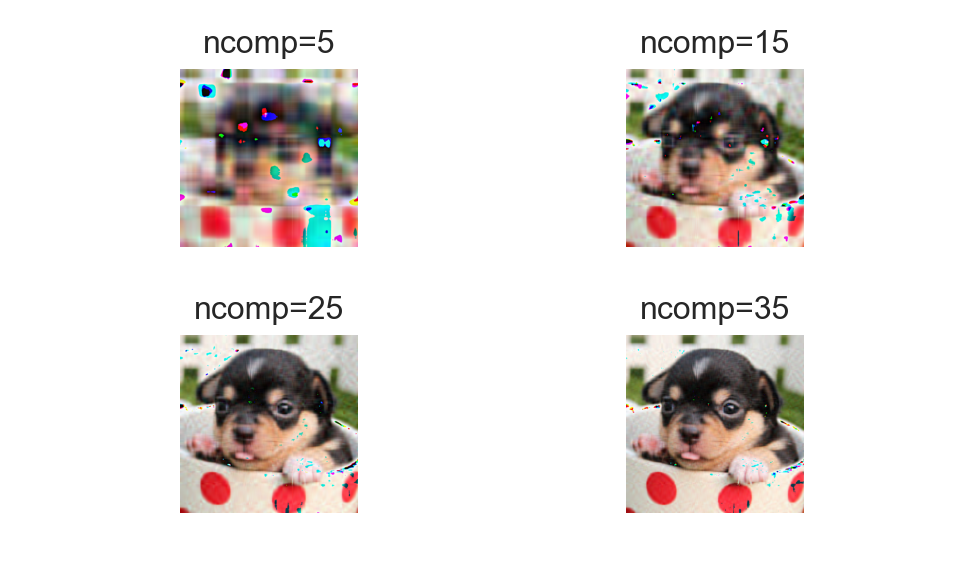
plt.close()5 Add line and text
Function like adding line and text is needed for projects about shape detection.
from PIL import ImageDraw

draw = ImageDraw.Draw(Im1)
draw.line([(35,65),(35,90),(60,90),(60,65),(35,65)],fill="green")
draw.text((35,54),"eye",fill = 'red')

plt.figure()
plt.imshow(Im1)
temp = plt.axis('off')
plt.show()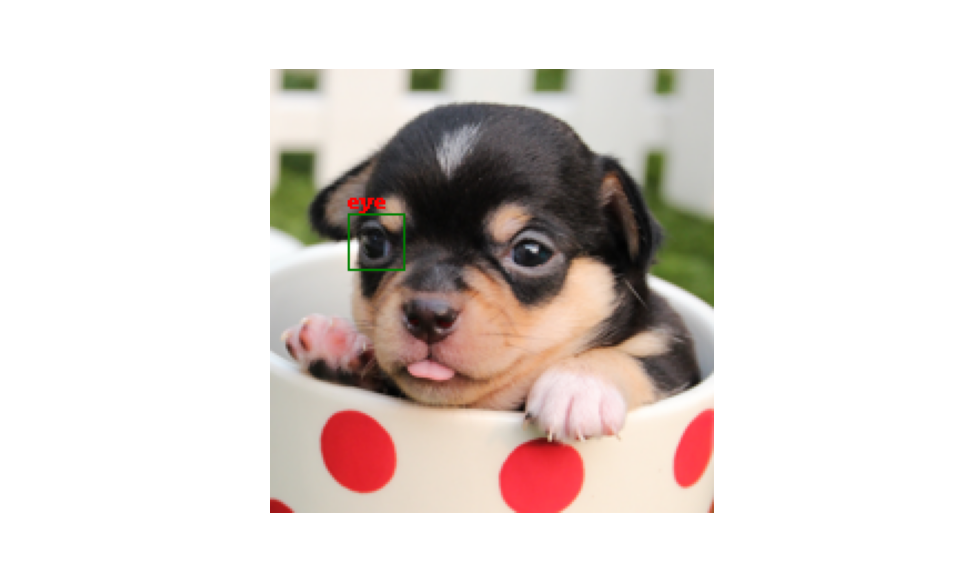
plt.close()