Contour plot by matplotlib
Kevin Liu
5/10/2020
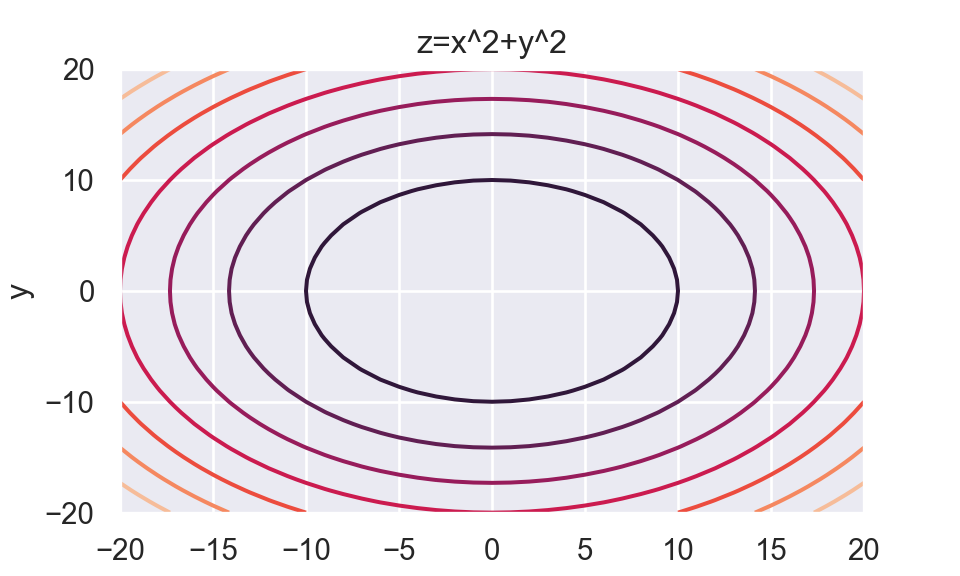
I will create contour plot for following function:
\[z = f(x,y) = x^2 + y^2\]
import numpy as np
import matplotlib.pyplot as plt

def f(x,y):
  output = (x)**2 + (y)**2
  return output

delta = 1
x = np.arange(-20.0, 20.0+delta, delta)
y = np.arange(-20.0, 20.0+delta, delta)

X, Y = np.meshgrid(x, y)
Z = f(X,Y)
fig,ax = plt.subplots()
ax.contour(X,Y,Z)
## <matplotlib.contour.QuadContourSet object at 0x000001644A596AF0>plt.title("z=x^2+y^2")
plt.xlabel("x")
plt.ylabel("y")
plt.show()