Plot Area Under Curve
Kevin Liu
5/26/2020
I reproduce figure 2.4 from Robert and Casella (2005). This is a fun execrise using matplotlib.
Plot \(f(x)\) and \(g(x)\) by matplotlib. Show area under both curves.
\[f(x) = \exp \left(-x^{2} / 2\right)\left(\sin (6 x)^{2}+3 \cos (x)^{2} \sin (4 x)^{2}+1\right)\]
\[g(x)=\exp \left(-x^{2} / 2\right) / \sqrt{2 \pi}\]
import numpy as np
import pandas as pd
import matplotlib.pyplot as plt

def f(x):
  p1 = np.exp(-(x**2)/2)
  p2 = (np.sin(6*x))**2 + 3*((np.cos(x))**2)*(np.sin(4*x))**2 + 1
  output = p1 * p2
  return output

def g(x):
  output = 5 * np.exp(-(x**2)/2)
  return output

df_p1 = pd.DataFrame({'x':np.arange(-4,4+0.01,0.01)})
df_p1['y'] = f(df_p1['x'])
df_p2 = pd.DataFrame({'x':np.arange(-4,4+0.01,0.01)})
df_p2['y'] = g(df_p2['x'])

fig,ax = plt.subplots()
ax.plot(df_p2['x'], df_p2['y'], color = '#ff7f0e', label = "g(x)")
ax.fill_between(df_p2['x'],df_p2['y'], alpha = 0.2, color = '#ff7f0e')
ax.plot(df_p1['x'], df_p1['y'], color = '#1f77b4', label = "f(x)")
ax.fill_between(df_p1['x'],df_p1['y'], alpha = 0.5, color = '#1f77b4')
temp = ax.legend()
plt.show()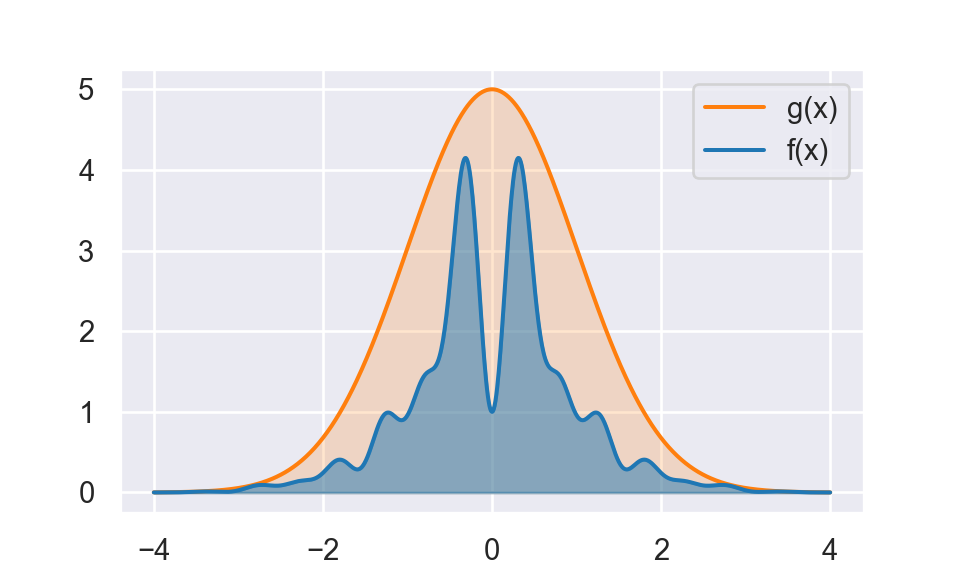
plt.close()References
Robert, Christian P., and George Casella. 2005. Monte Carlo Statistical Methods (Springer Texts in Statistics). Berlin, Heidelberg: Springer-Verlag.